What Are Good Average Triathlon Times? A Complete Guide

How long does a triathlon take? The answer can be anything from just over an hour to the better part of a day. A Sprint triathlon, for example, typically takes most people around 1.5 hours to complete, but a full Ironman can stretch anywhere from 11 to 15 hours. Of course, these are just ballpark figures—the race course, weather conditions, and your own fitness play a huge role.
Your Guide to Average Triathlon Times at a Glance
Before we get into the nitty-gritty of split times, age groups, and race-day variables, let's establish a simple, high-level benchmark. Knowing the typical finish times for each major triathlon distance gives you an instant frame of reference for your own goals and achievements.
Whether you're a first-timer whose main goal is just to cross the finish line or a seasoned pro chasing a new personal record, these averages are your starting point. Think of them as a map of the triathlon world—they show you what’s generally considered a strong performance and what separates beginners from the front of the pack. This context is crucial for setting goals that are both realistic and motivating.
Finding Your Benchmark
To get you started, here's a quick look at average triathlon times across the four main distances. The table below breaks down what you can expect for a Sprint, Olympic, Half-Ironman (70.3), and full Ironman, sorted by three common skill levels.
- Beginner: This is you if you're new to the sport, probably tackling your first or second race. The main goal is usually to finish, feel good, and figure out how this whole multi-sport thing works.
- Intermediate: You've got a few races under your belt and a decent training base. You’re no longer just trying to survive; you're looking to get faster and more competitive in your age group.
- Advanced: You're a dedicated triathlete who trains with a specific, structured plan. You're not just participating—you're competing, often aiming for a podium spot or a highly competitive finish.
Use the table below as your quick-reference guide. See where you might fit in now, or use it to circle a tangible goal for your next big race.
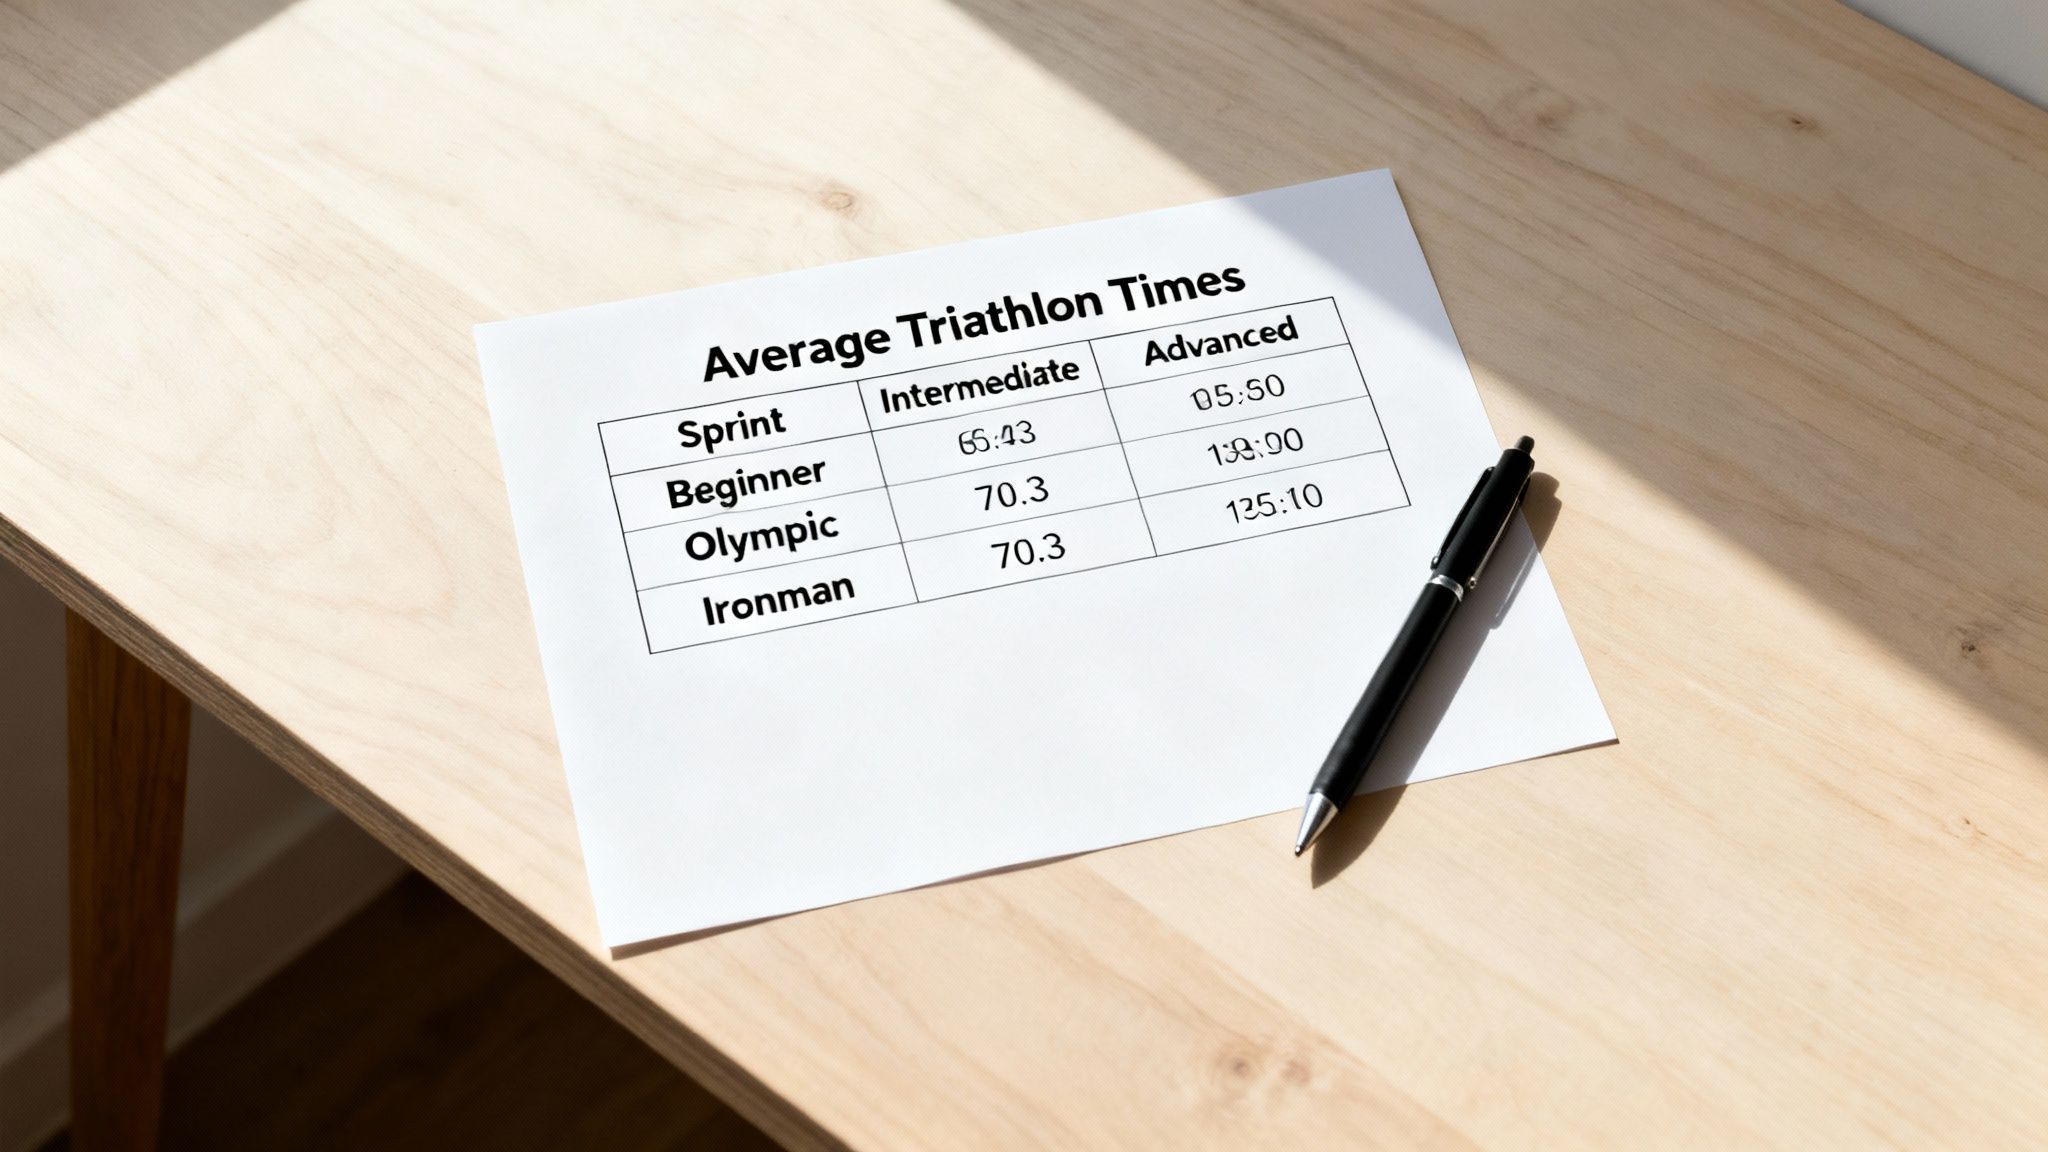
Average Triathlon Finish Times By Skill Level and Distance
| Distance | Beginner Average Time | Intermediate Average Time | Advanced Average Time |
|---|---|---|---|
| Sprint | 1:45 - 2:00 | 1:15 - 1:30 | Under 1:10 |
| Olympic | 3:15 - 3:45 | 2:30 - 3:00 | Under 2:20 |
| Ironman 70.3 | 6:30 - 7:30 | 5:15 - 6:15 | Under 5:00 |
| Ironman | 13:00 - 15:00 | 11:00 - 12:30 | Under 10:30 |
These times give you a great general idea of what's possible and what to aim for. Remember, though, that they represent a wide range of athletes and courses. The real magic happens when you start breaking these numbers down further, which is exactly what we'll do next.
How the Pros Made Us All Faster
To really get a feel for what an "average" triathlon time means today, you have to look at how much the sport has grown up. The kinds of finish times that committed age-groupers now post were once seen as the absolute limit of human endurance, only possible for the toughest pioneers of the sport. This isn't just a history lesson—it’s a cool story about what's possible when technology, training, and a relentless drive to be better come together.
Think about it this way: when you set a goal to finish an Ironman in under 12 hours, you're chasing a time that was once a world record. Seeing how fast the elites have gotten shows us that the whole sport is leveling up. What once seemed impossible is now a common benchmark. That's a direct result of smarter training, better nutrition, and incredible gear that has made its way from the pros to the rest of us.
From a Grueling Slog to an All-Out Sprint
The story of the Ironman distance really captures this amazing evolution. In the early days, just finishing was the name of the game. It was a raw test of will with little more than a standard road bike and a pair of running shoes. Now, it's a high-tech race where every second is calculated.
You can see this shift just by looking at the world records. Gordon Haller, the first person to ever finish the Hawaii Ironman back in 1978, did it in 11 hours, 46 minutes, and 58 seconds—a legendary display of pure grit. Just two years later, Dave Scott crushed that time, finishing in 9 hours and 24 minutes. That massive jump was the start of a new era. Today, the record stands at Magnus Ditlev's jaw-dropping 7:23:24, which included an unbelievable 3:57:45 bike split. You can follow a timeline of these historic Ironman records to see the full story.
That four-hour drop in the world record isn't just about the top athletes. It has completely changed the game for everyone.
Today's amateur triathletes are standing on the shoulders of giants. A sub-12-hour Ironman, a huge goal for so many age-groupers, was once the peak of professional performance. That context makes your own goals part of the sport's incredible story of progress.
The Ripple Effect on the Rest of Us
Those blistering speeds at the front of the race have a direct impact on everyone else on the course. The gear and strategies first developed for the pros are now standard issue for amateurs, and it's making everyone faster.
- Better Gear: Aero bikes, carbon-plated running shoes, and slippery wetsuits used to be exotic pro-only equipment. Now, they're available to everyone, and this tech alone can shave huge chunks of time off your race.
- Smarter Training: We have access to tools like power meters, heart rate monitors, and powerful training platforms like TrainingPeaks. This allows everyday athletes to train with a level of precision that was once only possible in elite training camps.
- Dialed-In Nutrition: Fueling isn't a guessing game anymore. Amateurs now have access to scientifically formulated gels, drinks, and chews to nail their nutrition, avoid the dreaded bonk, and hold a strong pace deep into the race.
All this innovation means that the "average" triathlete today is way more prepared and knowledgeable than the athletes of a few decades ago. The entire bell curve of finish times has shifted. A time that used to be considered exceptionally fast is now just competitive, and the definition of a good average triathlon time keeps getting faster, pushed along by the amazing things happening at the very top of the sport.
Sprint and Olympic Triathlon Times: What to Expect
While the epic distances of long-course racing get a lot of attention, the real heart of the sport for most of us is in the shorter events. Sprint and Olympic triathlons are the most popular formats for a reason—they offer an intense, accessible challenge that really tests your speed, power, and how fast you can get through those transitions.
So, let's get into the numbers for these dynamic races.
The Sprint triathlon is a brilliant entry point into the sport. It consists of a 750m swim, a 20km bike ride, and a 5km run. It's just long enough to feel like a real endurance accomplishment but short enough that you can train for it with a focused block of time. Most first-timers can expect to cross the finish line between 1 hour and 45 minutes to 2 hours. More competitive age-groupers are often aiming for times between 1 hour 15 minutes and 1 hour 30 minutes.
The Olympic distance, which you see in the Games, doubles that challenge: a 1.5km swim, a 40km bike, and a 10km run. This race is a different beast and requires a bit more thought on pacing and endurance. For many athletes, cracking the 3-hour mark is a huge milestone.
Average Sprint Triathlon Times and Splits
What counts as a "good" Sprint time is totally personal, but we can use averages to get a solid starting point. One thing you'll always notice is how much time is spent on two wheels—the bike leg consistently makes up around 50% of your total race time.
Here’s what the splits might look like for a solid, middle-of-the-pack finish around the 1 hour and 30 minute mark:
- Swim (750m): Somewhere around 15-20 minutes. This works out to a pace of roughly 2:00 to 2:40 per 100 meters, which is a very achievable target for most swimmers.
- T1 (Swim to Bike Transition): About 3-4 minutes. Honestly, practicing your transitions is one of the easiest ways to shave off free time from your overall finish.
- Bike (20km): Usually takes 45-50 minutes. This means you're holding an average speed of 24-27 km/h (15-17 mph), a really respectable pace for an age-group athlete.
- T2 (Bike to Run Transition): Aim to get this done in 2-3 minutes. A quick shoe change, and you're out on the final leg.
- Run (5km): Expect this to take 25-30 minutes. That's a 5:00-6:00/km pace (8:00-9:40/mile), which always feels a lot tougher after you've already swum and biked.
Of course, the pros are in a league of their own. They can knock out a Sprint triathlon in under an hour, which is just mind-boggling speed across all three sports.
A Deeper Look at Olympic Distance Averages
The Olympic distance demands a smarter approach to how you use your energy. If you go all-out on the bike, you're setting yourself up for a very painful shuffle on the 10k run. A great goal for many intermediate triathletes is to finish somewhere between 2 hours 45 minutes and 3 hours 15 minutes.
This distance has been the standard since the 2000 Sydney Olympics, and in that time, we've seen elite times tumble. Alistair Brownlee’s incredible 1:45:01 and Flora Duffy’s 1:55:36 show what's possible at the absolute peak of the sport. While those times are on another planet for most of us, the pros show what can be achieved and inspire our own goals.
For the rest of us, here's a rough breakdown for a 3-hour Olympic finish:
Swim (1.5km): 30-35 minutes (2:00-2:20/100m pace)
T1: 4 minutes
Bike (40km): 1 hour 30 minutes (~26.5 km/h or 16.5 mph)
T2: 3 minutes
Run (10km): 50-55 minutes (5:00-5:30/km pace)
That 10k run is often where the race is won or lost. Pacing it well is a test of both your fitness and your discipline, especially with 40km of biking already in your legs. For more on what it takes to run a strong standalone 10k, take a look at our complete guide on the average 10k time.
Getting a handle on these average times is your first step. They give you a realistic framework to build your training plan, set smarter goals, and track your progress as you become a stronger, faster triathlete.
Breaking Down Half and Full Ironman Finish Times
Stepping up to long-course triathlon is a completely different ballgame. Forget raw speed; this is about strategic endurance. Your success hinges on pacing, nutrition, and pure mental grit. Let’s dive into the average times for both the Ironman 70.3 and the full Ironman to give you a solid set of benchmarks for these monumental challenges.
The Ironman 70.3 (or "half-Ironman") consists of a 1.2-mile (1.9km) swim, a 56-mile (90km) bike, and a 13.1-mile (21.1km) run. For a lot of athletes, it's the perfect sweet spot between extreme endurance and achievable speed. The full Ironman, of course, doubles everything: a grueling 2.4-mile (3.8km) swim, a 112-mile (180km) bike ride, and a full 26.2-mile (42.2km) marathon.
Understanding Average Ironman 70.3 Times
The 70.3 distance is where pacing becomes a true art form. If it's your first time, a fantastic goal is simply to finish feeling strong. Most first-timers land somewhere between 6 hours 30 minutes and 7 hours 30 minutes.
More seasoned age-groupers tend to clock in between 5 hours 15 minutes and 6 hours 15 minutes. If you can break that five-hour barrier, you’re officially in the top tier of amateur racers.
So, how does a solid 6-hour finish break down? Let's look at the splits:
- Swim (1.2 miles): Roughly 40 minutes. This works out to a steady 2:05 per 100 meters. The goal here is efficiency, not speed, to save your energy for the long day ahead.
- T1 (Swim to Bike): A quick 5 minutes. You aren't sprinting through transition like in a sprint race, but you don't want to waste time, either.
- Bike (56 miles): Around 3 hours and 10 minutes. This means holding an average speed of about 17.7 mph (28.5 km/h)—a solid pace that won't completely fry your legs for the run.
- T2 (Bike to Run): Another 5 minutes to get your running gear on and head out.
- Run (13.1 miles): About 2 hours. That's a 9:09 per mile (5:41 per km) pace, which is incredibly respectable on tired legs.
While these are great targets for the rest of us, the pros operate on another planet. The men's world record is a mind-bending 3:26:06, and the women's is 3:53:01. It’s a powerful reminder of what the human body is capable of. You can learn more about these incredible triathlon world records and what they mean for the sport.
Analyzing Full Ironman Finish Times
The full Ironman is the ultimate one-day test of endurance. Just hearing your name called as you cross that finish line is a life-changing moment. Most races have a cutoff time around 17 hours, and for most amateur athletes, finishing between 12 and 14 hours is a huge accomplishment. Competitive age-groupers will often chase that sub-12 or even sub-11-hour mark.
The secret to a good Ironman? It's all about the bike. It is so easy to feel good early on and push too hard, only to pay the price tenfold during the marathon.
There’s an old saying in long-course racing: "Bike for show, run for dough." A smart, conservative bike ride sets you up for a strong run. It's not about getting a bike PR; it's about not having to walk the marathon.
Let's break down what a 13-hour Ironman finish looks like in practice:
- Swim (2.4 miles): 1 hour and 20 minutes. This is a relaxed 2:05 per 100-meter pace. You're just trying to get through the water without burning too many matches.
- Bike (112 miles): 6 hours and 45 minutes. This demands an average speed of around 16.6 mph (26.7 km/h), a truly sustainable effort that leaves gas in the tank.
- Run (26.2 miles): 4 hours and 40 minutes. This comes out to a 10:40 per mile (6:38 per km) pace, which realistically includes walk breaks and time at aid stations.
- Transitions: Budget about 15 minutes in total for T1 and T2 combined.
Taking on a long-course race requires a serious commitment. Building a solid training base isn't optional, and having a good plan is your roadmap to success. If this epic challenge is calling your name, a great place to start is our guide on building your first Ironman training plan.
The Hidden Factors That Shape Your Race Day
A finish time is so much more than a number on a results sheet. It's the story of your day, shaped by every hill, gust of wind, and fumbled water bottle. While average triathlon times give us a great starting point for goal setting, they don't capture the real-world chaos that can completely change your performance.
Getting a handle on these variables is what separates a good race plan from a great one. It’s also why comparing your time from a flat, fast course to a notoriously brutal one is like comparing apples and oranges. A subtle shift in conditions can have a massive impact on the clock, so it's all about context.
The Course Profile
Without a doubt, the single biggest variable is the race course itself. An Ironman 70.3 on a pancake-flat route in Florida is a totally different beast than the same distance on the relentless hills of Wisconsin. Elevation is the great equalizer, forcing even the strongest pros to back off and respect the terrain.
- Hilly Bike Courses: A bike leg with some serious climbing can easily pile on 20-30 minutes to an Olympic distance race. For a full Ironman, you could be looking at an hour or more. Every ascent saps power from your legs, demanding a huge effort just to keep moving forward.
- Challenging Swims: Open water is nothing if not unpredictable. A choppy swim against a stiff current can tack on minutes to your time before you even hit the timing mat for T1, leaving you gassed before the real work begins.
The Weather Effect
Weather is the ultimate wild card. A forecast that looks perfect can quickly turn into a battle against the elements once you're out there on the course.
Extreme heat and humidity are especially brutal. Your body has to work overtime just to keep itself cool, diverting precious energy away from your legs and lungs. A hot day can transform the marathon of an Ironman into a survival shuffle, easily adding 30-60 minutes to your run split. It’s the same story with strong headwinds on the bike—it feels like you’re pedaling through mud, burning way more matches for a slower speed.
A finish time is always relative. It’s a measure of your performance against the specific challenges of that day, on that course. Don't let a "slow" time on a tough day overshadow a brilliant effort.
The Art of Transitions
Often ignored by newcomers, transitions are truly the "fourth discipline" of triathlon. This is where you find what seasoned athletes call "free speed"—time you save not by being fitter, but simply by being more organized and practiced.
A messy, panicked T1 (swim-to-bike) can easily cost you three or four minutes. In a Sprint or Olympic race, that's a massive amount of time to give away. Rehearsing your transitions—from stripping your wetsuit to clipping on your helmet—can shave minutes off your total time with zero extra fitness required. Getting through a transition in under 90 seconds is an excellent benchmark for short-course racing.
These are the factors that make a personal best feel so incredible. It's that rare day when your training, the course, and the conditions all click into place. By understanding them, you can start racing smarter, learning to adapt your strategy to whatever the day decides to throw at you.
Using Average Times to Build Your Personal Race Plan
Knowing the average triathlon times is one thing, but the real magic happens when you turn that data into a personal roadmap for your race. These numbers aren't a rigid standard you have to meet. Instead, think of them as your compass.
They point you toward your natural strengths, shine a light on where you can improve, and help you build meaningful goals that are both challenging and realistic. This is how you go from just finishing to racing with a clear strategy and purpose.
Start with an Honest Self-Assessment
Before you can chart a course, you have to know your starting point. Take a candid look at your current fitness across the swim, bike, and run. If you've done a race before, dig up those old results. If you're new to this, a few time trials will give you the baseline you need.
- Swim: Time yourself for a 750m swim (for a Sprint) or a 1.5km swim (for an Olympic) in a pool or safe open water.
- Bike: Use an indoor trainer or find a flat, safe stretch of road to see what your average speed is over 20km or 40km.
- Run: Figure out your current 5k or 10k time on fresh legs. This gives you a clear picture of your standalone running potential.
Once you have these baseline numbers, hold them up against the average splits for your age group. This simple comparison can be incredibly revealing. You might find you're already a front-of-the-pack swimmer but are giving back all that time (and then some) on the bike. That single insight is the foundation of a much smarter training plan.
Pinpoint Your Biggest Opportunities
Now it’s time to find the "low-hanging fruit." What's really holding you back? Is it your swim technique, or is it that your run pace completely falls apart after a hard bike? The data will tell you the story.
Let's say your bike split is 15 minutes slower than your age group average. Right there, you know that focusing on your cycling will give you the biggest bang for your buck in training.
Your goal isn't to become a world-class athlete in every discipline overnight. It's about making strategic improvements where they'll have the most impact on your overall finish time.
This targeted approach keeps you from spinning your wheels in areas where you’re already strong and channels your energy toward your biggest weaknesses. And let's not forget the final leg—the run is often where races are won and lost. For athletes taking on the full Ironman distance, a solid marathon finish is everything. Learning how to train for a marathon on its own can teach you invaluable lessons about pacing and endurance that pay huge dividends on race day.
Set SMART Goals for Each Discipline
With your baseline established and your opportunities identified, you can now set SMART goals: Specific, Measurable, Achievable, Relevant, and Time-bound. A vague goal like "get faster" is pretty much useless. What you need are precise, actionable targets for each leg of the race.
The worksheet below is a great way to structure your goals. It helps you turn abstract numbers into a concrete plan with specific workouts to get you there.
Sample Goal Setting Worksheet for an Olympic Triathlon
This simple template can help you translate the average time data into a personal, actionable plan for your next big race.
| Discipline | Current Time/Pace | Average Time (Your AG) | Personal Goal Time/Pace | Key Workouts to Improve |
|---|---|---|---|---|
| Swim | 22:00 (2:53/100m) | 18:00 (2:24/100m) | 19:30 (2:36/100m) | Technique drills, interval sets |
| Bike | 55:00 (21.8 km/h) | 48:00 (25 km/h) | 50:00 (24 km/h) | Hill repeats, long endurance rides |
| Run | 32:00 (6:24/km) | 28:00 (5:36/km) | 30:00 (6:00/km) | Brick workouts, tempo runs |
By filling this out, you're not just hoping to get faster—you're building the specific, targeted plan that will actually make it happen.
Got Questions? Let's Talk Specifics
Even after poring over spreadsheets and race results, a few common questions always seem to pop up. Let's tackle some of the nitty-gritty details that can make or break your race day.
How Much Slower Is a Hilly Course, Really?
Hills can be a real game-changer, especially on the bike. For an Olympic distance race, a bike course that's loaded with climbs could easily add 15 to 30 minutes to your time compared to a pancake-flat route.
Now, imagine that effect over a full Ironman. We’re talking about a potential difference of an hour or even more. This is exactly why you need to dig into a course's elevation profile long before you even think about setting a time goal.
What’s a Good Transition Time?
Transitions are the "fourth discipline" of triathlon, and getting them right is basically free speed. It’s time you can save without having to be any fitter. But what's a "good" time? It really depends on the race distance.
- Sprint & Olympic: For the shorter stuff, fast age-groupers are often in and out of T1 (swim-to-bike) in under 2 minutes and through T2 (bike-to-run) in under 90 seconds.
- 70.3 & Ironman: In long-course racing, the game changes. A solid goal is to keep each transition under 4-5 minutes. It’s less about a mad dash and more about being smooth and efficient to conserve energy for the long day ahead.
Am I a Front, Middle, or Back-of-the-Pack Triathlete?
Curious where you stack up? The simplest way to figure this out is to look up the official results from one of your past races and see where you landed in your age group. Most race results will even show your percentile ranking.
As a general rule of thumb, the top 10-15% of finishers are what we'd call "front-of-the-pack." The huge majority of us—from the 15th to the 75th percentile—make up the "middle-of-the-pack." The final 25% are the "back-of-the-pack," whose main goal is often the incredible achievement of crossing that finish line.
Your race tells a story of dedication and strength. At RoutePrinter, we turn that story into a beautiful, personalized print that celebrates your achievement. Design your custom race poster today and let your finish line live on.